Notes on Hand-Building Lineups for DFS NBA
I want to document some guiding points for a creating a qualified pool of players when hand-building NBA DFS lineups.
Positional matchups, vegas lines, and individual player usage rates were obvious metrics to look at but the stronger consideration of team pacing has led to a consistent showing of DFS lineups scoring 300+ fantasy points this 2025-26 NBA season.
A clear focus on game environment over the “stud” quality of individual players seems to make all the difference in NBA DFS.
Follow @sportsmonetizeNote:These guiding points can evolve and will be updated as I gain fresh perspectives on daily fantasy.
Also, this article focuses on – FULL ROSTER FANDUEL NBA SLATES (REGULAR SEASON)
Vegas line . Over/Under
Preferred Link: Rotogrinders
Before looking at any players, we are first looking at the over/under for all games included in the chosen slate. Identify the games with the most points. Games that are competitive with low blowout risk.
High total, tight spread. Period.
Identify which games have an over/under of 225 or higher. A tighter spread could make a game with a slightly lower total more appealing, but more points are always good.
Target tight spreads that are no more than 3 points. Larger spreads indicate possible blowouts. Look to tighter spreads in hopes of competitive/overtime prone game settings.
Competitive games can lead to increased value for players and help inform roster decisions.
Pace
Preferred Link: Hollinger’s NBA Team Stats – Pace
A team’s pace speaks to the number of possessions per game. Opportunity matters and in a paced up game there are more opportunities and points to go around.
Target games set to run at a higher pace. The Vegas total will reflect the pace considerations but there may still be a slight advantage to a team being forced to pick up the pace.
I like pace up favorites more than pace up underdogs. If I’m considering a paced up underdog team, I would definitely want to check on efficiency numbers.
Here is a good time to look into contest selection based on how the pace and over/under of certain games are measuring up.
Defense Vs. Position
Preferred Link:Hashtag Basketball – Defense Vs. Position
While understanding which teams are weak to what position is useful, I like understanding specifics within the position.
Knowing a team is extremely prone to turnover the ball to guards is more useful than simply seeing that they are weak defensively to guards. I can target a specific metric like average steals to decide between various guards on deep teams or with ambiguous minute shares.
For example, take a look at where Portland is weak in the image below.
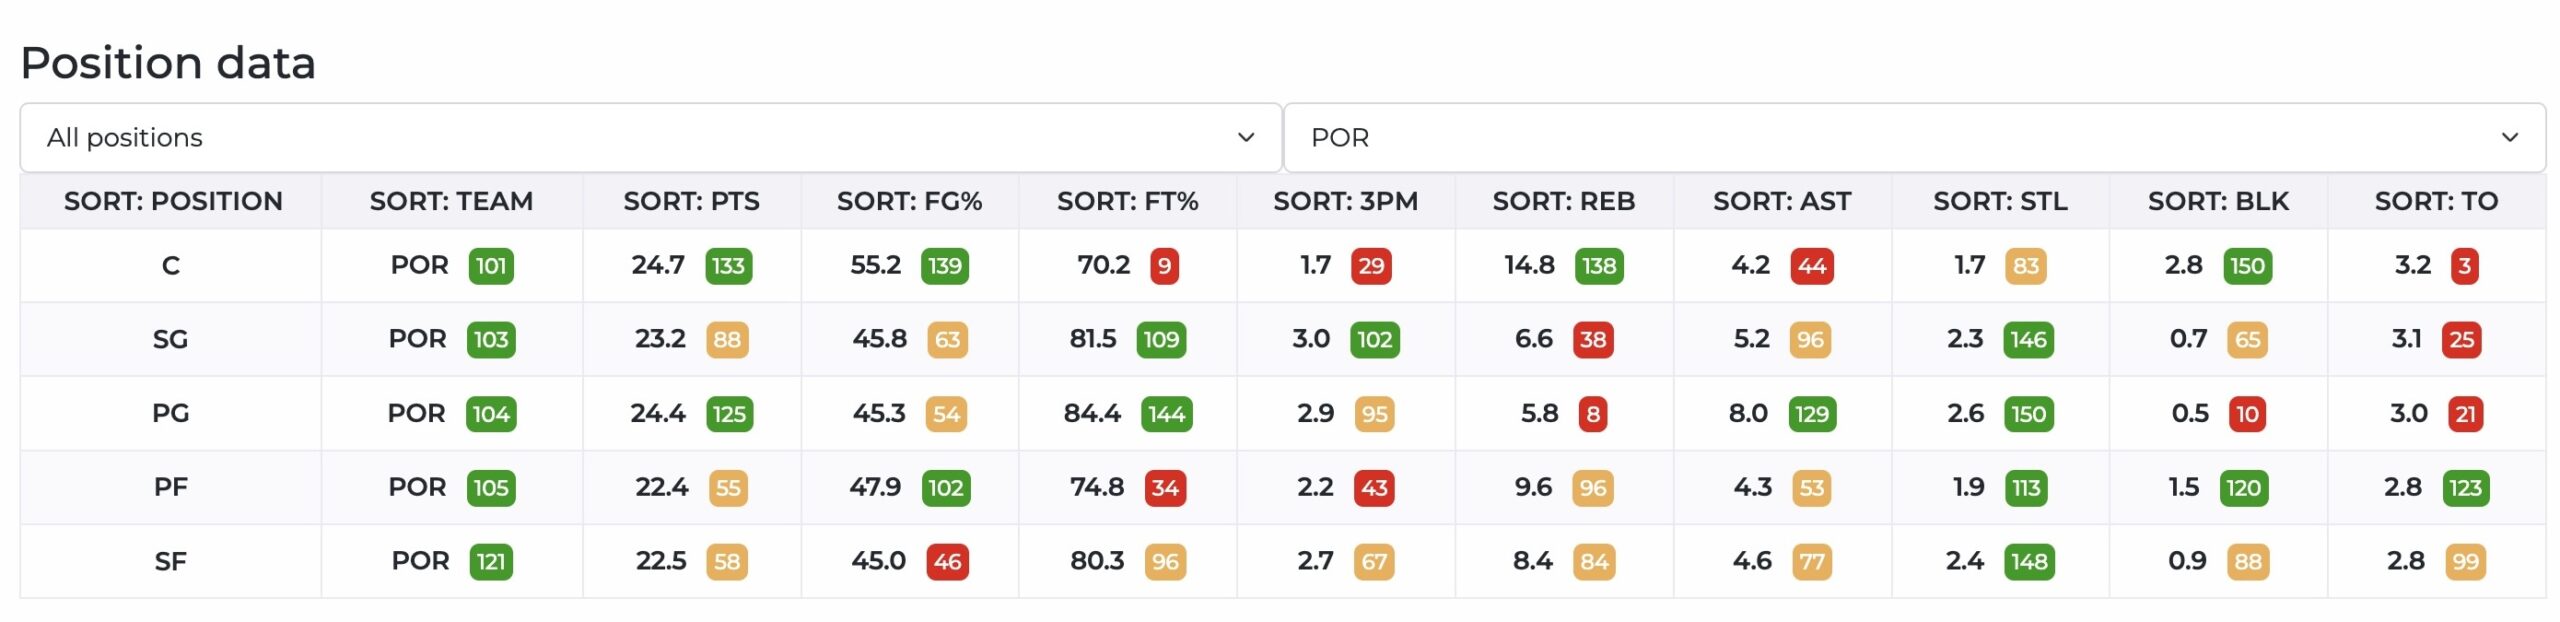
While I could estimate, based on the full panel of “green” on the left side, that I could pick just any player opposing Portland that would be only be part of the picture.
But if I look at “STEALS” there is a trend, especially when I zero in on the guard positions. I can see that “STEALS” are labeled “green” and above 136. A center against Portland could be good, but an opposing guard averaging 2 steals a game with a 21% usage rate might be better.
Identify trackable metrics alongside good defensive matchups to find higher quality players. A general idea of where a team is weak isn’t enough if there are ways to identify more details.
Minutes & Usage
Preferred Link: NBA Stuffer NBA Player Stats
Minutes trump usage rate. Players need to be on the court in order to be utilized at all.
Identify which players either typically play or are expected to play 25 minutes or more. There is nuance to this when you consider other factors like the rotations for the Grizzlies or overall usage distribution on the Suns.
Identify which players have a usage rate of 20% or more. Again, there is wiggle room here when considering game environment and injuries.
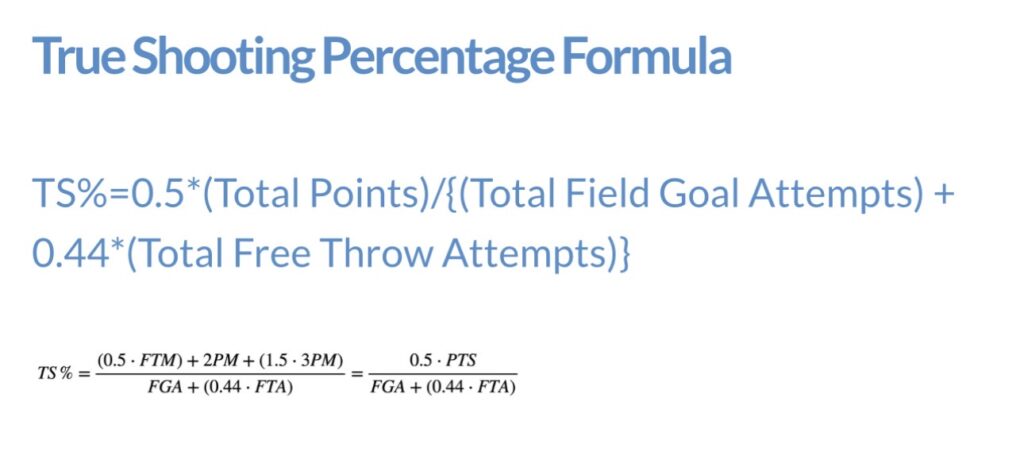
True Shooting Percentage
Preferred Link: True Shooting Percentage Calculator
If you have looked at every other metric mentioned up until this point then you have a solid set of players to choose from but now you must account for players who are stellar offensively when given the opportunity but can become liabilities defensively.
Think of players like Cam Thomas.
Now I initially thought, a simple defensive metric is what I should be watching, but the Cam Thomas issue speaks to the creation of defensive issues not just poor defense alone.
Efficient offense (i.e accurate shooting) can make up for poor defense to an extent but imagine the issues when inefficient offense CREATES poor defense.
Missed shots = more transition opportunities for the opposing team
Consistent issues with shooting accuracy can create fast break points and compound a team’s defensive liability.
Identify any player whose TS% is trending down over the last 10-15 games. There is a space to possibly compare this metrics like turnovers to get a fuller picture.

Entrepreneur | Web Publisher
Playing daily fantasy since 2018. Creating content on daily fantasy sports, business, and sports data analytics.